Usd
 Forexlive - Dec 18th, 2024
USDJPY Technical Analysis – All eyes on the FOMC decision
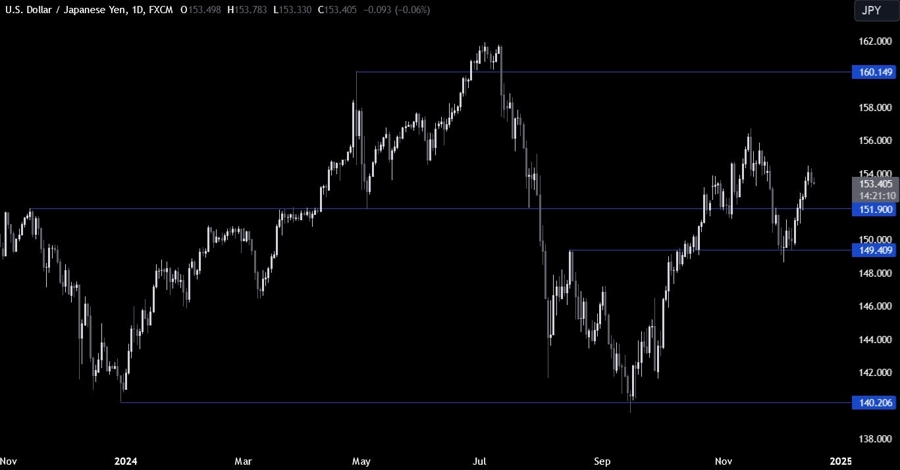
FundamentalOverviewThe USD continues toconsolidate around the highs except against the commodity currencies where itextended into new highs. The US inflation data last week was once again adisappointment although the data that feeds into the Core PCE was overallbenign as forecasters expect a 0.13% M/M increase. Nonetheless, the Treasuryyields have continued to climb and are now back around the post-US electionhighs. There’s some understandable uneasiness in the bond market given the hotUS data and the Fed continuing to cut into an accelerating economy. The Fed today is expectedto cut by 25 bps bringing the FFR to 4.25-4.50%. We will also get the updatedSummary of Economic Projections (SEP) where growth and inflation should berevised upwards, and the Dot Plot will likely show two rate cuts in 2025. FedChair Powell should acknowledge the strength in the US data and announce aslowdown in the pace of easing. This is already priced inas the market expects just two rate cuts in 2025, with the first one coming inMarch at the earliest. Therefore, the market reaction will be driven bydeviations from the expectations. On the JPY side, nothinghas changed fundamentally, and the market firmed up the expectations for nochange at this week’s BoJ decision. Most of the USDJPY gains though have beendriven by the rise in Treasury yields, so the focus now is on the FOMC decisionas it will impact Treasury yields and therefore the USDJPY pair. USDJPYTechnical Analysis – Daily TimeframeOn the daily chart, we cansee that USDJPY pulled back a bit from the recent high as we head into the FOMC.From a risk management perspective, the buyers will have a better risk toreward setup around the 151.90 support to position for a rally into the 160.00 handlenext. The sellers, on the other hand, will want to see the price breaking lowerto increase the bearish bets into the 149.40 level.USDJPY TechnicalAnalysis – 4 hour TimeframeOn the 4 hour chart, we cansee that the price broke below the upward trendline that was defining the bullishmomentum on this timeframe. This might be a signal for a deeper pullback intothe 151.90 support. The sellers will likely pile in around these levels toposition for a drop into the support, while the buyers will look for a rallyback above the trendline to position for new highs. USDJPY TechnicalAnalysis – 1 hour TimeframeOn the 1 hour chart, we cansee that we have a counter-trendline defining the current pullback. The sellerswill likely lean on this trendline to keep targeting the support, while thebuyers will look for a break higher to position for new highs. The red linesdefine the average daily range for today. UpcomingCatalystsToday, we have the FOMC Policy Decision. Tomorrow, we have the BoJ RateDecision and the US Jobless Claims figures. On Friday, we conclude the week withthe Japanese CPI and the US PCE data.See the video below This article was written by Giuseppe Dellamotta at www.forexlive.com.
Showing 1 to 1 of 1 results